Quantile Regression
Similar to Linear Regression, Quantile Regression estimates the conditional median instead of the conditional mean.
Decision Tree
Decision Tree is a classification algorithm.
Information Gain
Given the following training set {S}:
|
X1 |
X2 |
Y |
|
a |
c |
e |
|
a |
d |
e |
|
b |
d |
f |
|
b |
d |
f |
We need to define the first level of the decision tree by choosing one of the two features x1 or x2. We need to calculate the Information Gain (I) for each case, and select the feature with higher Information Gain.
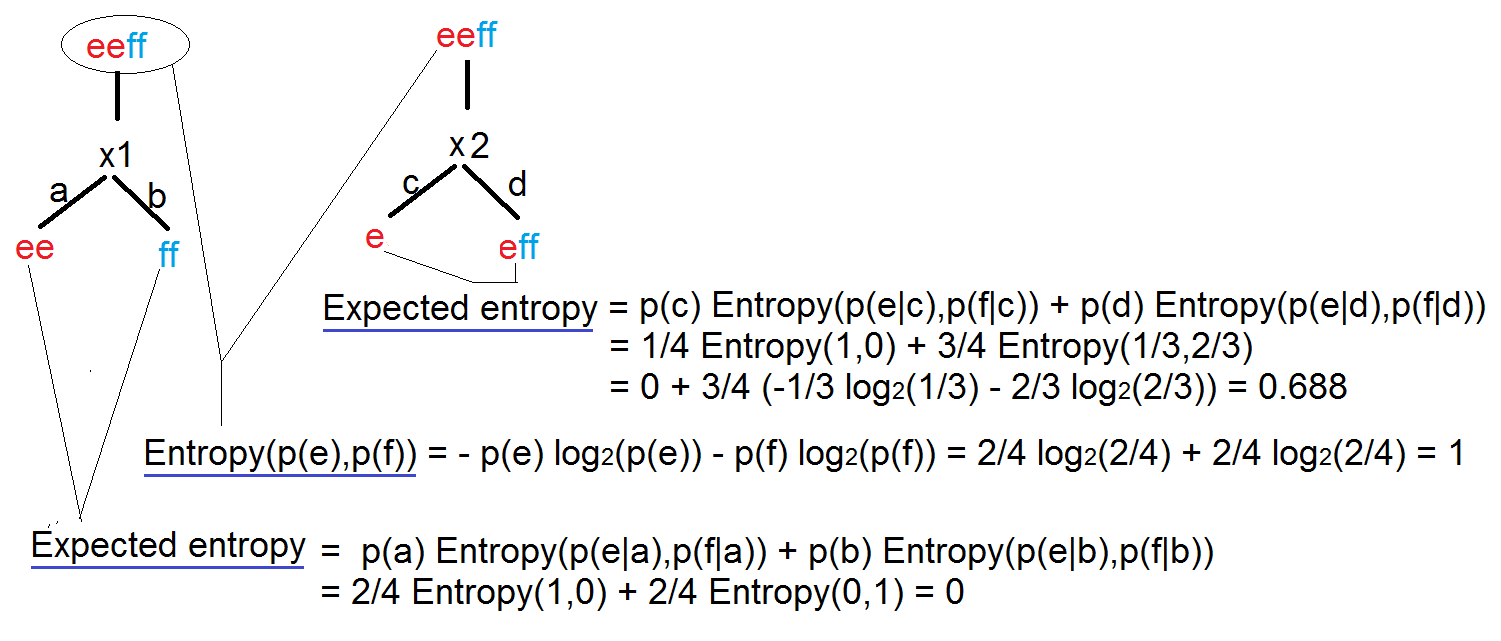
When training the model, always use data with equal number of rows for each output, so the entropy of the root node equals to 1. (Entropy measure the uncertainty of the data).
Each node of the tree defines a probability estimation for each output.
More details: https://www.youtube.com/watch?v=-dCtJjlEEgM
Standard Deviation Reduction
Another approach to select features that define the levels of a decision tree is by calculating the Standard Deviation Reduction.
Boosted Decision Tree
A boosted decision tree is an ensemble learning method in which the second tree corrects for the errors of the first tree, the third tree corrects for the errors of the first and second trees, and so forth. The data points which were misclassified receives a bigger weight in the data, the ones correctly classified received a diminished weight. The idea is that with each iteration, the data points misclassified have increasing importance, allowing the learner to fit better and improve accuracy.
Predictions are based on the entire ensemble of trees together that makes the prediction.
Random Forest
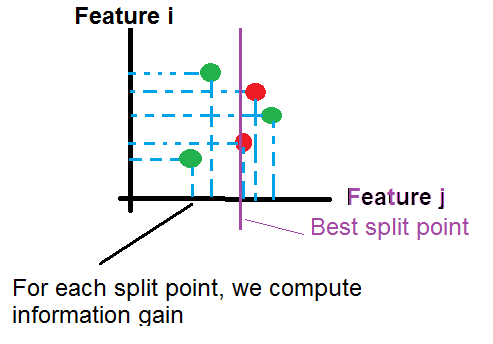
When we have thousand of features (d), calculating the Information Gains for each split point and for each feature requires a lot of time and resources.
The idea in the Random Forest algorithm is to:
1-select a subset of size N from the training data
2-Pick up randomly k features, project the data on the k features, and select the split point with higher information gain.
Repeat step 2 until the creation of the tree (we can stop the operation at a certain depth of tree).
Repeat step 1 and 2 to generate more trees.
For a new example, we push it through all trees until it reaches the corresponding leaves. then we calculate the probability as the average of probabilities generated by all trees:
\(P(y=k|x) = \frac{1}{nbr\ trees} \sum_{t=1}^{nbr\ trees} P_t(y=k|x)\)