Evaluation Contexts
There are 3 types of evaluation contexts.
|
Row Context
|
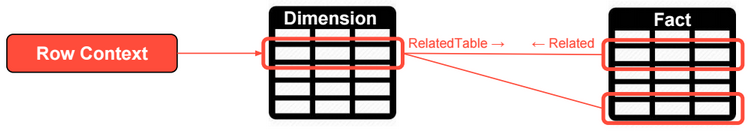
Row context includes the values from all columns in a row and related rows.
Row contexts doesn’t propagate through relationships (from the one side to the many side of one-to-many relationships).
|
|
Filter Context
|
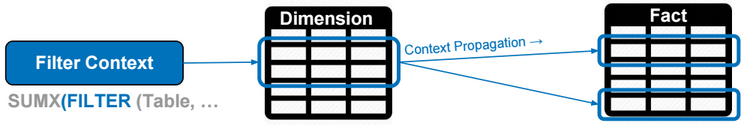
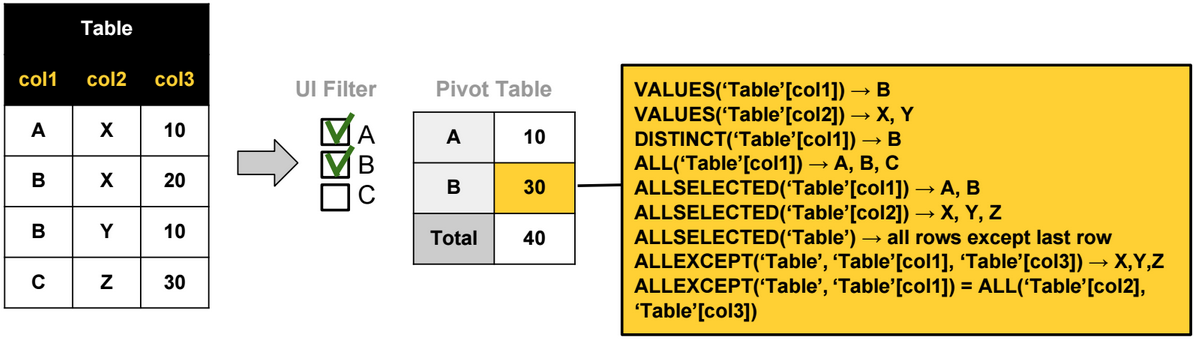
Filter context specifies filter constraints on the set of values allowed in a column or a table.
Filter context propagates through relationships.
|
|
Query Context
|
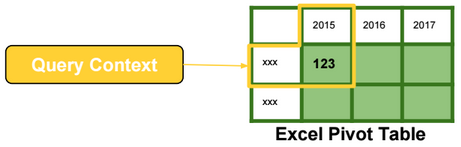
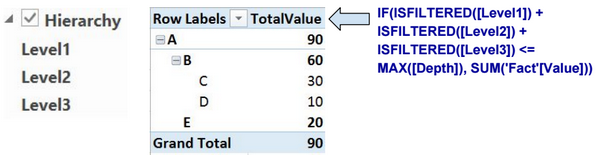
Query context is the filtering applied to a cell in the pivot table.
The filter context and the query context are almost identical in their effects.
|
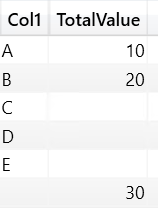
X Functions
X Functions are iterators. They evaluate expressions by iterating over table rows.
The following DAX expression is evaluated by running a loop over rows of the Sales table.
[TotalSales] = SUMX (Sales, Sales[Quantity] * Sales[Net Price])
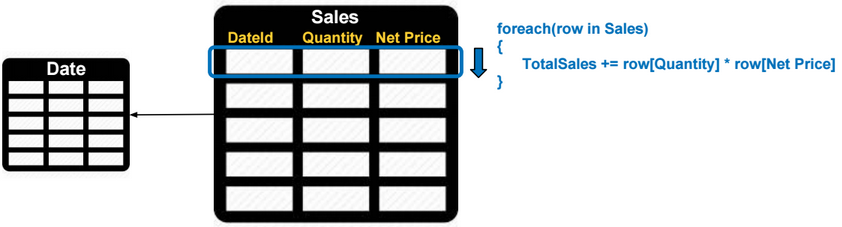
Rows with values not allowed in the filter/query context are ignored.
Context Transition
Context transition is the transformation of row contexts into an equivalent filter context.
For example, to evaluate the DAX expression below, we need to iterate over rows in the Date table. For each Date row, we need to evaluate the measure TotalSales, and then calculate the average of daily sales.
AvgDailySales = AverageX(Date, [TotalSales])
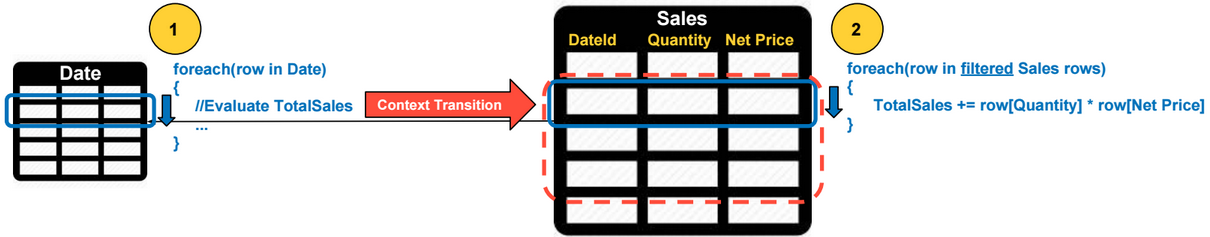
For each Date row, a context transition occurs, and values from all columns in a Date row are used as filters when evaluating the TotalSales. Context transition occurs because TotalSales is a measure.
Context transition automatically occurs when the input expression of the X function is a measure, otherwise we need to use the CALCULATE function to perform context transitions like in the following example:
AvgDailySales = AverageX(Date, CALCULATE(SUMX(Sales, Sales[Quantity] * Sales[Net Price])))
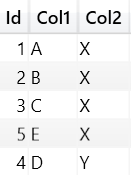
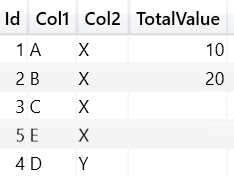
Filter Context Intersection
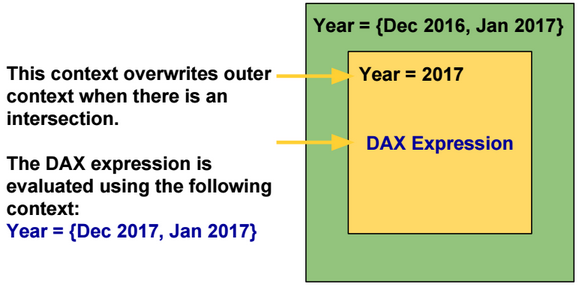
By default inner filter contexts overwrite outer filter contexts when there is an intersection.
The KEEPFILTERS function modifies this behavior by using Intersect instead of Overwrite.
|
|
Overwrite
|
Intersect
|
|
-Outer Filter Context: {Dec 2016, Jan 2017}
-Inner Filter Context: {Year = 2017}
|
{Dec 2017, Jan 2017}
|
{Jan 2017}
|
Filter Function
Filter function is also an iterator. It filters rows based on a list of input conditions.
Calculate Function
CALCULATE evaluates an expression in a context that is modified by the specified filters.
The following DAX expressions are equivalent. The filter expression of the calculate function can be a table.
[TotalSales2017] = CALCULATE([TotalSales], ‘Date'[Year] = 2017)
[TotalSales2017] = CALCULATE([TotalSales], FILTER(ALL(‘Date'[Year]), ‘Date'[Year] = 2017)
CALCULATE always performs context transition by transforming row context to filter context. In the DAX expressions above, the row context is empty.
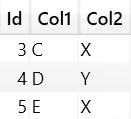
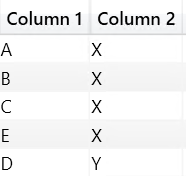
Context Propagation
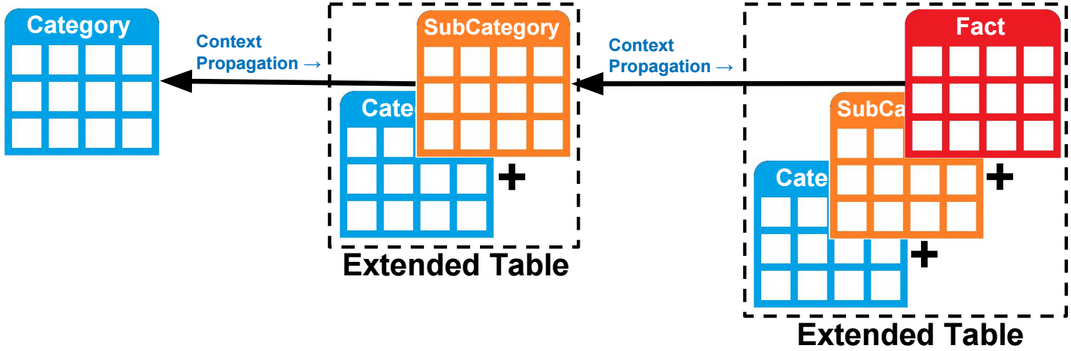
Filter context propagates (by default) from the one side to the many side of a one-to-many relationship.
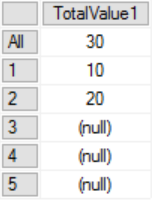
Filter context can also propagates from the many side to the one side of a one-to-many relationship. For example, the DAX expression below counts the number of rows in the category table when one or many sub categories are selected.
CALCULATE(COUNTROWS(‘Category’), ‘SubCategory‘)
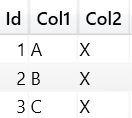
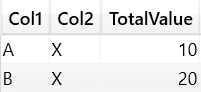
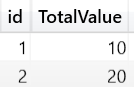
In reality, there is no context propagation, but instead, tables are extended to include all columns in related tables, and filtering a column instantly filters all extended tables referencing that column.
To propagate a filter context from the many side to the one side of a one-to-many relationship, we need to use the Calculate function and specify as parameter the many side table.
ALL function removes all filters defined on a table and related tables. To keep filters defined on a related table, we need to specify that related table as a parameter to the calculate function.
CALCULATE(COUNTROWS(‘SubCategory’), ALL(‘SubCategory’), ‘Category’)
Relationships
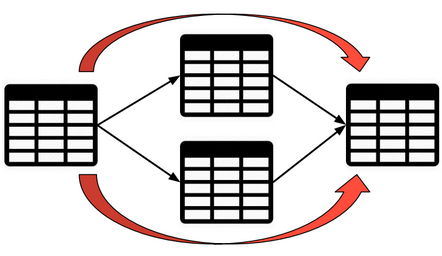
Relationships in a model could be one-way or two-way. A relationship is deactivated if it’s causing ambiguity in the model.
The model below shows two paths to propagate contexts from the table on the left to the one on the right. This model is not supported and one of the relationships should be deactivated.
To activate and use a relationship when evaluating a DAX expression, we can use the USERELATIONSHIP function.
CALCULATE([TotalSales], USERELATIONSHIP(Sales[OrderDate],Date[Id]))
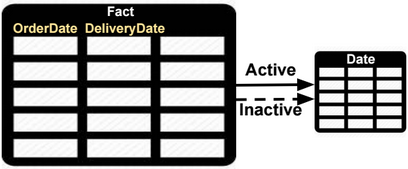
To change the filter direction of a relationship, we can use the CROSSFILTER function.
CALCULATE([TotalSales], CROSSFILTER(Sales[OrderDate],Date[Id], BOTH))
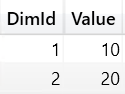
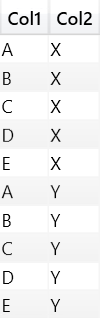
Many-to-many Relationships
Relationships in a model could be one-way or two-way. In a two-way relationship, filter contexts propagate in both directions.
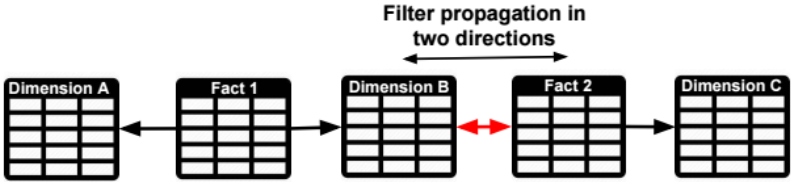
If the model doesn’t support two-way relationships, then we need to specify the many-to-many (M2M) fact table as parameter of the Calculate function.
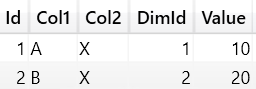
For example, if we want to propagate a filter on Dimension C to Fact1, we only need to specify Fact 2 as parameter of the Calculate function. The extended Fact 2 table includes all columns of related tables (Dimensions B and C), and filtering Fact 2 table also filters Dimension B columns that are in the extended Fact 2 table.
CALCULATE([TotalSales], Fact2)
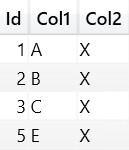
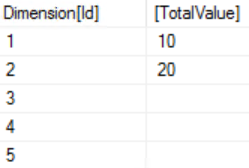
Virtual Relationships
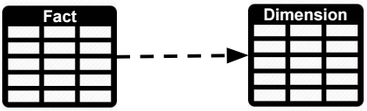
We can simulate a relationship between two tables using DAX. For example to calculate the TotalSales for values in a dimension table we can use the following formula:
CALCULATE([TotalSales], FILTER(‘Fact’, CONTAINS(‘Dimension’, ‘Dimension'[Id], ‘Fact'[Id])))
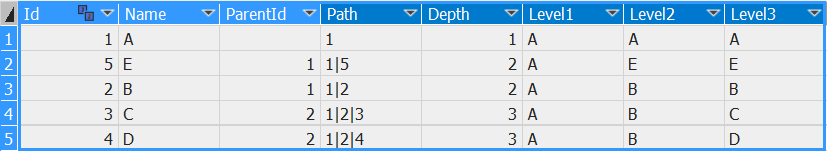
Calculated Column vs Measure
|
Calculated column
|
Consume more memory.
The filter context is always empty when defining a Calculated Column.
|
|
Measure
|
Consume more CPU.
The filter context is automatically applied on measures.
|