Machine Learning Algorithms – Part 3

This post describes some geometric machine learning algorithms.

K-Nearest Neighbor Regression

k-nearest neighbors regression algorithm (k-NN regression) is a non-parametric method used for regression. For a new example x, predict y as the average of values \(y_1, y_2, …, y_k\) of k nearest neighbors of x.

K-Nearest Neighbor Classifier

k-nearest neighbors classifier (k-NN classifier) is a non-parametric method used for classification. For a new example x, predict y as the most common class among the k nearest neighbors of x.

Support Vector Machine (SVM)

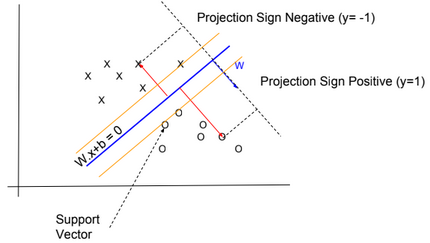
In SVM, y has two values -1 or 1, and the hypothesis function is \(h_{W,b}(x) = g(W^T x + b)\) with g(z) = {1 if z >= 0, otherwise -1}.

We need to find W and b so \(W^T x + b\) >> 0 when y=1 and \(W^T x + b\) << 0 when y=-1

Functional margin

\(\widehat{?}^{(i)} = y^{(i)} . (W^T x^{(i)} +b)\)

We want that this function be >> 0 for all values of x.

We define \(\widehat{?} = min \ \widehat{?}^{(i)}\) for all values of i

Geometric margin

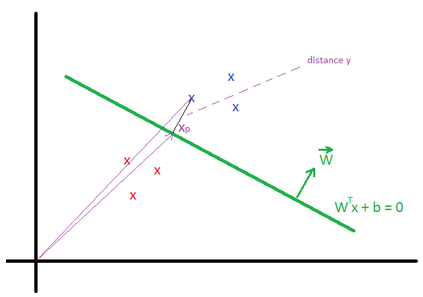
Geometric margin \(?^{(i)}\) is the geometric distance between an example \(x^{(i)}\) and the line defined by \(W^Tx + b = 0\). We define \(x_p^{(i)}\) as the point of projection of \(x^{(i)}\) on the line.

The vector \(\overrightarrow{x}^{(i)} = \overrightarrow{x_p}^{(i)} + ?^{(i)} * \frac{\overrightarrow{W}}{||W||} \)

\(x_p^{(i)}\) is in the line, then \(W^T (x^{(i)} – ?^{(i)} * \frac{W}{||W||}) + b = 0\)

We can find that \(?^{(i)} = \frac{W^T x^{(i)} + b}{||W||} \)

More generally \(?^{(i)} = y^{(i)}(\frac{W^T x^{(i)}}{||W||} + \frac{b}{||W||}) \)

We define \(? = min {?}^{(i)}\) for all values of i

We can deduce that the Geometric margin(?) = Functional margin / ||W||

Max Margin Classifier

We need to maximize the geometric margin \(?\), in other words \(\underset{W, b, ?}{max}\) ?, such as \(y^{(i)}(\frac{W^T x^{(i)}}{||W||} + \frac{b}{||W||})\) >= ? for all values \((x^{(i)},y^{(i)})\).

To simplify the maximization problem, we impose a scaling constraint: \(\widehat{?} = ? * ||W|| = 1\).

The optimization problem becomes as follow: \(\underset{W, b}{max}\frac{1}{||W||}\) (or \(\underset{W, b}{min}\frac{1}{2}||W||^2\)), such as \(y^{(i)}(W^T x^{(i)} + b)\) >= 1 for all values \((x^{(i)},y^{(j)})\).

Using the method of Lagrange Multipliers, we can solve the minimization problem.

\(L(W, b, ?) = \frac{1}{2} ||W||^2 – \sum_{i=1}^m ?_i * (y^{(i)}(W^T x^{(i)} + b) – 1)\)

Based on the KKT conditions, \(?_i >= 0\) and \(?_i * (y^{(i)}(W^T x^{(i)} + b) – 1) = 0\) for all i.

We know that \(y^{(i)}(W^T x^{(i)} + b) – 1 = 0\) is true only for few examples (called support vectors) located close to the the line \(W^Tx + b = 0\) (for these examples, \(? = {?}^{(i)} = \frac{1}{||W||}\)), therefore \(?_i\) is equal to 0 for the majority of examples.

By deriving L, we can find:

\(\frac{\partial L(W, b, ?)}{\partial w} = W – \sum_{i=1}^m ?_i * y^{(i)} * x^{(i)} = 0 \\ \frac{\partial L(W, b, ?)}{\partial b} = \sum_{i=1}^m ?_i * y^{(i)} = 0\)

After multiple derivations, we can find the equations for W, b and ?.

More details can be found in this video: https://www.youtube.com/watch?v=s8B4A5ubw6c

Predictions

The hypothesis function is defined as: \(h_{W,b}(x) = g(W^T x + b) = g(\sum_{i=1}^m ?_i * y^{(i)} * K(x^{(i)}, x) + b) \)

The function \(K(x^{(i)}, x) = ?(x^{(i)})^T ?(x) \) is known as the kernel function (? is a mapping function).

When ?(x) = x, then \(h_{W,b}(x) = g(\sum_{i=1}^m ?_i * y^{(i)} * (x^{(i)})^T . x + b) \)

Kernels

There are many types of kernels: “Polynomial kernel”, “Gaussian kernel”,…

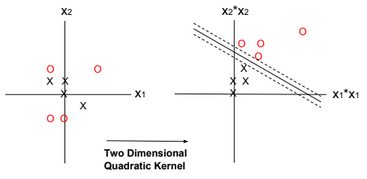
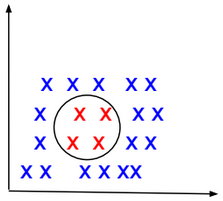
In the example below the kernel is defined as Quadratic Kernel. \(K(x^{(i)}, x) = ?(x^{(i)})^T ?(x)\) and \(?(x) = (x_1^2, x_2^2, \sqrt{2} x_1 x_2)\). By using this kernel, SVM can find a linear separator (or hyperplane).

Regularization

Regularization can be applied to SVM by adding an extra term to the minimization function. The extra term relaxes the constraints by introducing slack variables. C is the regularization parameter.

\(\underset{W, b, ?_i}{min}\frac{||W||^2}{2} \color{red} {+ C \sum_{i=1}^m ?_i }\), such as \(y^{(i)}(W^T x^{(i)} + b)\) >= 1 – ?i for all values \((x^{(i)},y^{(j)})\) and \(?_i >= 0\).

The regularization parameter serves as a degree of importance that is given to miss-classifications. SVM poses a quadratic optimization problem that looks for maximizing the margin between both classes and minimizing the amount of miss-classifications. However, for non-separable problems, in order to find a solution, the miss-classification constraint must be relaxed.

As C grows larger, wrongly classified examples are not allowed, and when C tends to zero the more miss-classifications are allowed.

One-Class SVM

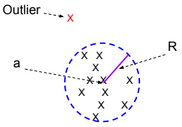
One-Class SVM is used to detect outliers. It finds a minimal hypersphere around the data. In other words, we need to minimize the radius R.

The minimization function for this model is defined as follow:

\(\underset{R, a, ?_i}{min} ||R||^2 + C \sum_{i=1}^m ?_i \), such as \(||x^{(i)} – a||^2 \leq R^2 + ?i\) for all values \((x^{(i)},y^{(j)})\) and \(?_i >= 0\).

Perceptron Algorithm

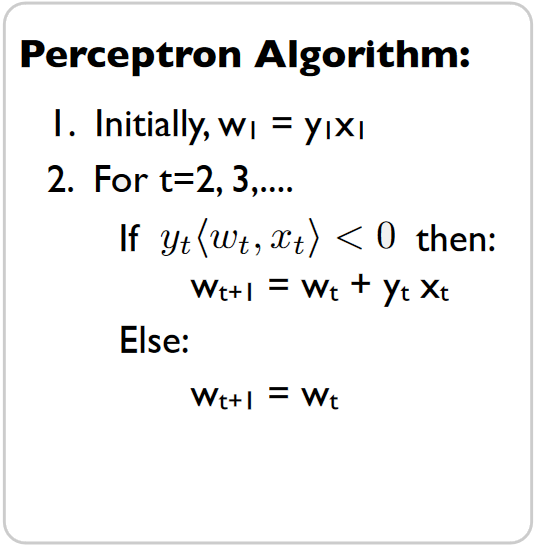
Similar to SVM, the Perceptron algorithm tries to separate positive and negative examples. There is no notion of kernel or margin maximization when using the perceptron algorithm. The algorithm can be trained online.

Averaged Perceptron Algorithm

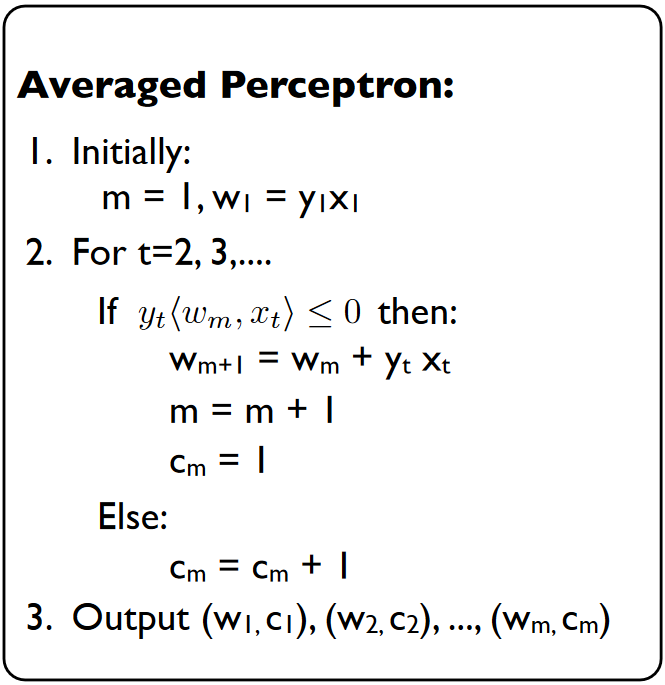
Averaged Perceptron Algorithm is an extension of the standard Perceptron algorithm; it uses averaged weights and biases.

The classification of a new example is calculated by evaluating the following expression:

\(? = sign(\sum_{i=1}^m c_i.w_i^T.x + b_i)\)

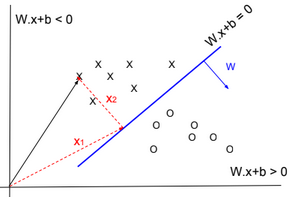
Note: the sign of wx+b is related to the location of the point x.

w.x+b = w(x1+x2)+b = w.x2 because x1 is located on the blue line then w.x1+b = 0.

w.x2 is positive if the two vectors have the same direction.

K-means

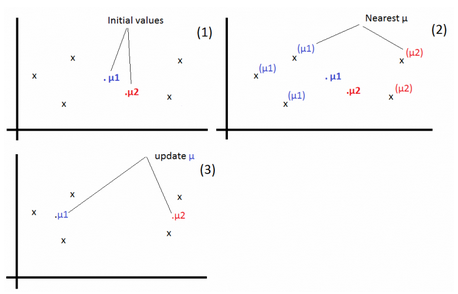
Given a training set \(S = \{x^{(i)}\}_{i=1}^m\). We define k as the number of clusters (groups) to create. Each cluster has a centroid \(\mu_k\).

1-For each example, find j that minimizes: \(c^{(i)} := arg\ \underset{j}{min} ||x^{(i)} – \mu_j||^2\)

2-Update \(\mu_j:=\frac{\sum_{i=1}^m 1\{c^{(i)} = j\} x^{(i)}}{\sum_{i=1}^m 1\{c^{(i)} = j\}}\)

Repeat the operations 1 & 2 until convergence.

Machine Learning Diagnostics

Large/Small Neural Networks

For a large amount of training data, use large networks.

Applying Machine Learning

Below the steps to apply machine learning to a business problem.

1-Collect DataSet

2-Prepare DataSet

3-Select & Design Model

4-Train Model

5-Evaluate Model

6-Test Model

Train/Dev/Test Sets

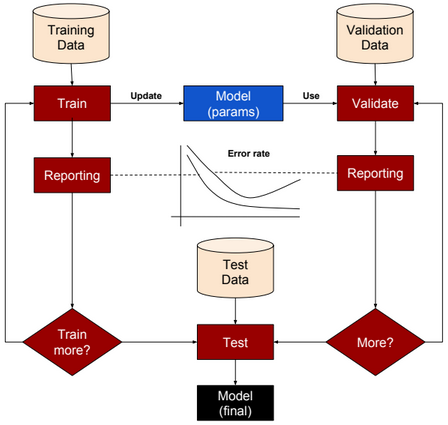
Training set: a set of examples used for training a ML model.

Dev (Validation or Cross-Validation) set: a set of examples used to tune hyper-parameters of a ML model.

Test set: a set of examples used to evaluate how well the model does with data outside the training/Dev set.

For deep learning algorithms, we no longer need to follow the common rules of (70%, 30%) ratios for Train and Test sets or (70%, 15%, 15%) ratios for Train, Dev and Test sets. Splitting data into 98% as training set and 2% as test set could be an acceptable option.

Error Analysis

Let us define first the following acronyms:

TP: True positive

FP: False positive

TN: True negative

FN: False negative

Accuracy

(TP + TN) / (TP + TN + FP + FN)

Precision

TP / (TP + FP)

Recall

TP / (TP + FN)

F1 score (best error metric)

2 (Precision * Recall) /(Precision + Recall)

Accuracy alone is a bad measure when data is skewed.

Machine Learning Algorithms – Part 2

This post describes some generative machine learning algorithms.

Gaussian Discriminant Analysis

Gaussian Discriminant Analysis is a supervised classification algorithm. In this algorithm we suppose the p(x|y) is multivariate Gaussian with parameter mean \(\overrightarrow{u}\) and covariance \(\Sigma : P(x|y) \sim N(\overrightarrow{u}, \Sigma) \).

If we suppose that y is Bernoulli distributed, then there are two distributions that can be defined, one for p(x|y=0) and one for p(x|y=1). The separator between these two distributions could be used to predict the values of y.

\(P(x|y=0) = \frac{1}{(2\pi)^{\frac{n}{2}}|\Sigma|^{\frac{1}{2}}} exp(-\frac{1}{2}(x – \mu_0)^T\Sigma^{-1}(x – \mu_0))\)

\(P(x|y=1) = \frac{1}{(2\pi)^{\frac{n}{2}}|\Sigma|^{\frac{1}{2}}} exp(-\frac{1}{2}(x – \mu_1)^T\Sigma^{-1}(x – \mu_1))\)

\(P(y) = \phi^y.(1-\phi)^{1-y}\)

We need to find \(\phi, \mu_0, \mu_1, \Sigma\) that maximize the log-likelihood function:

\(l(\phi, \mu_0, \mu_1, \Sigma) = log(\prod_{i=1}^{m} P(y^{(i)}|x^{(i)};\phi, \mu_0, \mu_1, \Sigma))\)

Using the Naive Bayes rule, we can transform the equation to:

\(= log(\prod_{i=1}^{m} P(x^{(i)} | y^{(i)};\mu_0, \mu_1, \Sigma) * P(y^{(i)};\phi))) – log(\prod_{i=1}^{m} P(x^{(i)}))\)

To maximize l, we need to maximize: \(log(\prod_{i=1}^{m} P(x^{(i)} | y^{(i)};\mu_0, \mu_1, \Sigma) * P(y^{(i)};\phi)))\)

For new data, to predict y, we need to calculate \(P(y=1|x) = \frac{P(x|y=1) * P(y=1)}{P(x|y=0)P(y=0) + P(x|y=1)P(y=1)}\) (P(y=0) and P(y=1) can be easily calculated from training data).

EM Algorithm

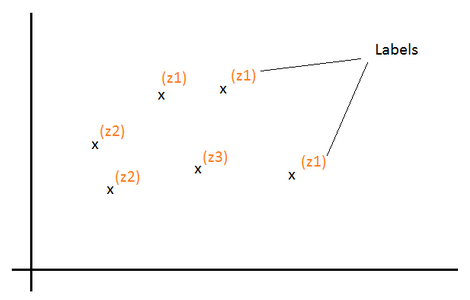
EM algorithm is an unsupervised clustering algorithm in which we assign a label to each training example. The clustering applied is soft clustering, which means that for each point we assign a probability for each label.

For a point x, we calculate the probability for each label.

There are two main steps in this algorithm:

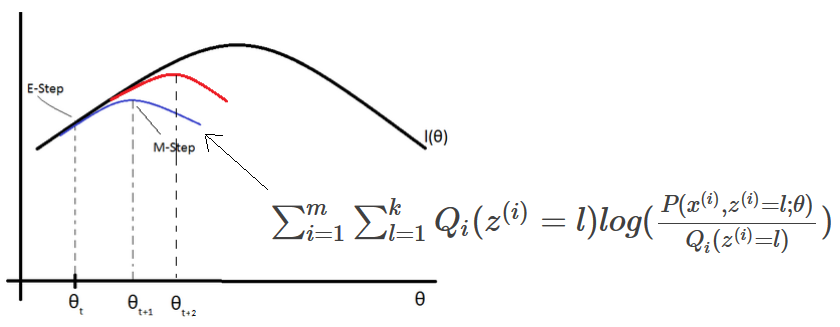
E-Step: Using the current estimate of parameters, calculate if points are more likely to come from the red distribution or the blue distribution.

M-Step: Re-estimate the parameters.

Given a training set \(S = \{x^{(i)}\}_{i=1}^m\). For each \(x^{(i)}\), there is hidden label \(z^{(i)}\) assigned to it.

Z is a multinomial distribution with \(P(z = j)=?_j\).

k the number of distinct values of Z (number of classes).

For each \(x^{(i)}\), we would like to know the value \(z^{(i)}\) that is assigned to it. In other words, find \(l \in [1, k]\) that maximizes the probability \(P(z^{(i)} = l | x^{(i)})\)

Log-likelihood function to maximize: \(l(?) = log(\prod_{i=1}^m P(x^{(i)}; ?)) = \sum_{i=1}^m log(P(x^{(i)}; ?))\)

\( = \sum_{i=1}^m log(\sum_{l=1}^k P(x^{(i)}|z^{(i)} = l; ?) * P(z^{(i)} = l))\) \( = \sum_{i=1}^m log(\sum_{l=1}^k P(x^{(i)}, z^{(i)} = l; ?))\)

Let’s define \(Q_i\) as a probability distribution over Z: (\(Q_i(z^{(i)} = l)\) > = 0 and \(\sum_{l=1}^k Q_i(z^{(i)} = l) = 1\))

\(l(?) = \sum_{i=1}^m log(\sum_{l=1}^k Q_i(z^{(i)} = l) \frac{P(x^{(i)}, z^{(i)} = l; ?)}{Q_i(z^{(i)} = l)})\) \( = \sum_{i=1}^m log(E_{z^{(i)} \sim Q_i}[\frac{P(x^{(i)}, z^{(i)}; ?)}{Q_i(z^{(i)})}])\)

Log is concave function. Based on Jensen’s inequality log(E[X]) >= E[log(X)].

Then:

\(l(?) >= \sum_{i=1}^m E_{z^{(i)} \sim Q_i}[log(\frac{P(x^{(i)}, z^{(i)}; ?)}{Q_i(z^{(i)})})]\) \( = \sum_{i=1}^m \sum_{l=1}^k Q_i(z^{(i)}=l) log(\frac{P(x^{(i)}, z^{(i)}=l; ?)}{Q_i(z^{(i)}=l)})\)

If we set \(Q_i(z^{(i)}) = P(z^{(i)}| x^{(i)}; ?)\) then: \(\frac{P(x^{(i)}, z^{(i)}; ?)}{Q(z^{(i)})}\) \(= \frac{P(z^{(i)}| x^{(i)}; ?) * P(x^{(i)}; ?)}{P(z^{(i)}| x^{(i)}; ?)}\) \(= P(x^{(i)}; ?)\) = Constant (over z). In that case log(E[X]) = E[log(X)] and for the current estimate of ?, \(l(?) = \sum_{i=1}^m \sum_{l=1}^k Q_i(z^{(i)}=l) log(\frac{P(x^{(i)}, z^{(i)}=l; ?)}{Q_i(z^{(i)}=l)})\) (E-Step)

EM (Expectation-Maximization) algorithm for density estimation:

1-Initiliaze the parameters ?

2-For each i, set \(Q_i(z^{(i)}) = P(z^{(i)}| x^{(i)}; ?)\) (E-Step)

3-Update ? (M-Step)

\(? := arg\ \underset{?}{max} \sum_{i=1}^m \sum_{l=1}^k Q_i(z^{(i)}=l) log(\frac{P(x^{(i)}, z^{(i)}=l; ?)}{Q_i(z^{(i)}=l)})\)

Mixture of Gaussians

Given a value \(z^{(i)}=j\), If x is distributed normally \(N(?_j, ?_j)\), then:

\(Q_i(z^{(i)} = j) = P(z^{(i)} = j| x^{(i)}; ?)\) \(= \frac{P(x^{(i)} | z^{(i)}=j) * P(z^{(i)} = j)}{\sum_{l=1}^k P(x^{(i)} | z^{(i)}=l) * P(z^{(i)}=l)}\) \(= \frac{\frac{1}{{(2?)}^{\frac{n}{2}} |?_j|^\frac{1}{2}} exp(-\frac{1}{2} (x^{(i)}-?_j)^T {?_j}^{-1} (x^{(i)}-?_j)) * ?_j}{\sum_{l=1}^k \frac{1}{{(2?)}^{\frac{n}{2}} |?_l|^\frac{1}{2}} exp(-\frac{1}{2} (x^{(i)}-?_l)^T {?_l}^{-1} (x^{(i)}-?_l)) * ?_l}\)

Using the method of Lagrange Multipliers, we can find \(?_j, ?_j, ?_j\) that maximize: \(\sum_{i=1}^m \sum_{l=1}^k Q_i(z^{(i)}=l) log(\frac{\frac{1}{{(2?)}^{\frac{n}{2}} |?_j|^\frac{1}{2}} exp(-\frac{1}{2} (x^{(i)}-?_j)^T {?_j}^{-1} (x^{(i)}-?_j)) * ?_j}{Q_i(z^{(i)}=l)})\) with the constraint \(\sum_{j=1}^k ?_j = 1\). We also need to set to zero the partial derivatives with respect to \(?_j\) and \(?_j\) and solve the equations to find the new values of these parameters. Repeat the operations until convergence.

More details about the algorithm can be found here: https://www.youtube.com/watch?v=ZZGTuAkF-Hw

Naive Bayes Classifier

Naive Bayes classifier is a supervised classification algorithm. In this algorithm, we try to calculate P(y|x), but this probability can be calculated using the naive bayes rule:

P(y|x) = P(x|y).P(y)/P(x)

If x is the vector \([x_1,x_2,…,x_n]\), then:

\(P(x|y) = P(x_1,x_2,…,x_n|y) = P(x_1|y) P(x_2|y, x_1) ….P(x_n|y, x_{n-1},…,x_1)\) \(P(x) = P(x1,x2,…,x_n)\)

If we suppose that \(x_i\) are conditionally independent (Naive Bayes assumption), then:

\(P(x|y) = P(x_1|y) * P(x_2|y) * … * P(x_n|y)\) \(= \prod_{i=1}^n P(x_i|y)\) \(P(x) = \prod_{i=1}^n P(x_i)\)

If \(\exists\) i such as \(P(x_i|y)=0\), then P(x|y) = 0. To avoid that case we need to use Laplace Smoothing when calculating probabilities.

We suppose that \(x_i \in \{0,1\}\) (one-hot encoding: [1,0,1,…,0]) and y \(\in \{0,1\}\).

We define \(\phi_{i|y=1}, \phi_{i|y=0}, \phi_y\) such as:

\(P(x_i=1|y=1) = \phi_{i|y=1} \\ P(x_i=0|y=1) = 1 – \phi_{i|y=1}\) \(P(x_i=1|y=0) = \phi_{i|y=0} \\ P(x_i=0|y=0) = 1 – \phi_{i|y=0}\) \(P(y) = \phi_y^y.(1-\phi_y)^{1-y}\)

We need to find \(\phi_y, \phi_{i|y=0}, \phi_{i|y=1}\) that maximize the log-likelihood function:

\(l(\phi, \phi_{i|y=0}, \phi_{i|y=1}) = log(\prod_{i=1}^{m} \prod_{j=1}^n P(x_j^{(i)}|y^{(i)}) P(y^{(i)})/P(x^{(i)}))\)

Or maximize the following expression:

\(log(\prod_{i=1}^{m} \prod_{j=1}^n P(x_j^{(i)}|y^{(i)}) P(y^{(i)}))\)

Machine Learning Algorithms – Part 1

This post describes some discriminative machine learning algorithms.

Distribution of Y given X

Algorithm to predict Y

Normal distribution

Linear regression

Bernoulli distribution

Logistic regression

Multinomial distribution

Multinomial logistic regression (Softmax regression)

Exponential family distribution

Generalized linear regression

Distribution of X

Algorithm to predict Y

Multivariate normal distribution

Gaussian discriminant analysis or EM Algorithm

X Features conditionally independent

\(p(x_1, x_2|y)=p(x_1|y) * p(x_2|y) \)

Naive Bayes Algorithm

Other ML algorithms are based on geometry, like the SVM and K-means algorithms.

Linear Regression

Below a table listing house prices by size.

x = House Size (\(m^2\))

y = House Price (k$)

50

99

50

100

50

100

50

101

60

110

For the size 50\(m^2\), if we suppose that prices are normally distributed around the mean μ=100 with a standard deviation σ, then P(y|x = 50) = \(\frac{1}{\sigma \sqrt{2\pi}} exp(-\frac{1}{2} (\frac{y-μ}{\sigma})^{2})\)

We define h(x) as a function that returns the mean of the distribution of y given x (E[y|x]). We will define this function as a linear function. \(E[y|x] = h_{θ}(x) = \theta^T x\)

P(y|x = 50; θ) = \(\frac{1}{\sigma \sqrt{2\pi}} exp(-\frac{1}{2} (\frac{y-h_{θ}(x)}{\sigma})^{2})\)

We need to find θ that maximizes the probability for all values of x. In other words, we need to find θ that maximizes the likelihood function L:

\(L(\theta)=P(\overrightarrow{y}|X;θ)=\prod_{i=1}^{n} P(y^{(i)}|x^{(i)};θ)\)

Or maximizes the log likelihood function l:

\(l(\theta)=log(L(\theta )) = \sum_{i=1}^{m} log(P(y^{(i)}|x^{(i)};\theta ))\) \(= \sum_{i=1}^{m} log(\frac{1}{\sigma \sqrt{2\pi}}) -\frac{1}{2} \sum_{i=1}^{n} (\frac{y^{(i)}-h_{θ}(x^{(i)})}{\sigma})^{2}\)

To maximize l, we need to minimize J(θ) = \(\frac{1}{2} \sum_{i=1}^{m} (y^{(i)}-h_{θ}(x^{(i)}))^{2}\). This function is called the Cost function (or Energy function, or Loss function, or Objective function) of a linear regression model. It’s also called “Least-squares cost function”.

J(θ) is convex, to minimize it, we need to solve the equation \(\frac{\partial J(θ)}{\partial θ} = 0\). A convex function has no local minimum.

There are many methods to solve this equation:

  • Gradient descent (Batch or Stochastic Gradient descent)
  • Normal equation
  • Newton method
  • Matrix differentiation

Gradient descent is the most used Optimizer (also called Learner or Solver) for learning model weights.

Batch Gradient descent

\(θ_{j} := θ_{j} – \alpha \frac{\partial J(θ)}{\partial θ_{j}} = θ_{j} – α \frac{\partial \frac{1}{2} \sum_{i=1}^{n} (y^{(i)}-h_{θ}(x^{(i)}))^{2}}{\partial θ_{j}}\)

α is called “Learning rate”

\(θ_{j} := θ_{j} – α \frac{1}{2} \sum_{i=1}^{n} \frac{\partial (y^{(i)}-h_{θ}(x^{(i)}))^{2}}{\partial θ_{j}}\)

If \(h_{θ}(x)\) is a linear function (\(h_{θ} = θ^{T}x\)), then :

\(θ_{j} := θ_{j} – α \sum_{i=1}^{n} (h_{θ}(x^{(i)}) – y^{(i)}) * x_j^{(i)} \)

Batch size should fit the size of CPU or GPU memories, otherwise learning speed will be extremely slow.

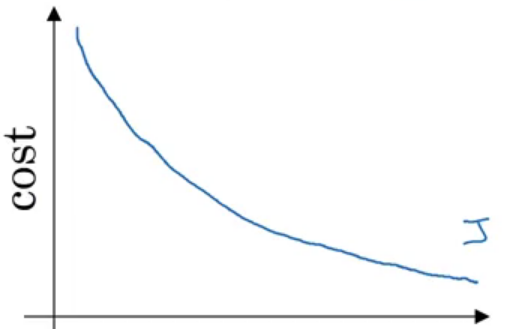
When using Batch gradient descent, the cost function in general decreases without oscillations.
Stochastic (Online) Gradient Descent (SGD) (use one example for each iteration – pass through all data N times (N Epoch))

\(θ_{j} := θ_{j} – \alpha (h_{θ}(x^{(i)}) – y^{(i)}) * x_j^{(i)} \)

This learning rule is called “Least mean squares (LMS)” learning rule. It’s also called Widrow-Hoff learning rule.

Mini-batch Gradient descent

Run gradient descent for each mini-batch until we pass through traning set (1 epoch). Repeat the operation many times.

\(θ_{j} := θ_{j} – \alpha \sum_{i=1}^{20} (h_{θ}(x^{(i)}) – y^{(i)}) * x_j^{(i)} \)

Mini-batch size should fit the size of CPU or GPU memories.

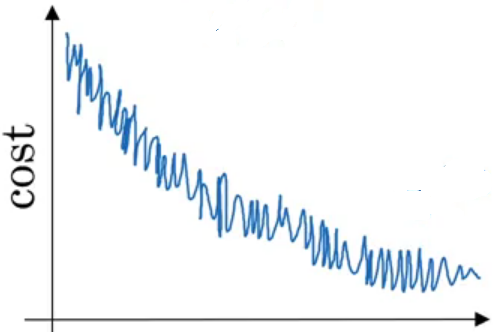
When using Batch gradient descent, the cost function decreases quickly but with oscillations.
Learning rate decay

It’s a technique used to automatically reduce learning rate after each epoch. Decay rate is a hyperparameter.

\(α = \frac{1}{1+ decayrate + epochnum} . α_0\)

Momentum

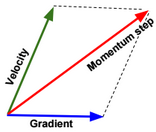
Momentum is a method used to accelerate gradient descent. The idea is to add an extra term to the equation to accelerate descent steps.

\(θ_{j_{t+1}} := θ_{j_t} – α \frac{\partial J(θ_{j_t})}{\partial θ_j} \color{blue} {+ λ (θ_{j_t} – θ_{j_{t-1}})} \)

Below another way to write the expression:

\(v(θ_{j},t) = α . \frac{\partial J(θ_j)}{\partial θ_j} + λ . v(θ_{j},t-1) \\ θ_{j} := θ_{j} – \color{blue} {v(θ_{j},t)}\)
Nesterov Momentum is a slightly different version of momentum method.

AdaGrad

Adam is another method used to accelerate gradient descent.

The problem in this method is that the term grad_squared becomes large after running many gradient descent steps. The term grad_squared is used to accelerate gradient descent when gradients are small, and slow down gradient descent when gradients are large.

RMSprop

RMSprop is an enhanced version of AdaGrad.

The term decay_rate is used to apply exponential smoothing on grad_squared term.

Adam optimization

Adam is a combination of Momentum and RMSprop.

Normal equation

To minimize the cost function \(J(θ) = \frac{1}{2} \sum_{i=1}^{n} (y^{(i)}-h_{θ}(x^{(i)}))^{2} = \frac{1}{2} (Xθ – y)^T(Xθ – y)\), we need to solve the equation:

\( \frac{\partial J(θ)}{\partial θ} = 0 \\ \frac{\partial trace(J(θ))}{\partial θ} = 0 \\ \frac{\partial trace((Xθ – y)^T(Xθ – y))}{\partial θ} = 0 \\ \frac{\partial trace(θ^TX^TXθ – θ^TX^Ty – y^TXθ + y^Ty)}{\partial θ} = 0\) \(\frac{\partial trace(θ^TX^TXθ) – trace(θ^TX^Ty) – trace(y^TXθ) + trace(y^Ty))}{\partial θ} = 0 \\ \frac{\partial trace(θ^TX^TXθ) – trace(θ^TX^Ty) – trace(y^TXθ))}{\partial θ} = 0\) \(\frac{\partial trace(θ^TX^TXθ) – trace(y^TXθ) – trace(y^TXθ))}{\partial θ} = 0 \\ \frac{\partial trace(θ^TX^TXθ) – 2 trace(y^TXθ))}{\partial θ} = 0 \\ \frac{\partial trace(θθ^TX^TX)}{\partial θ} – 2 \frac{\partial trace(θy^TX))}{\partial θ} = 0 \\ 2 X^TXθ – 2 X^Ty = 0 \\ X^TXθ= X^Ty \\ θ = {(X^TX)}^{-1}X^Ty\)

If \(X^TX\) is singular, then we need to calculate the pseudo inverse instead of the inverse.

Newton method
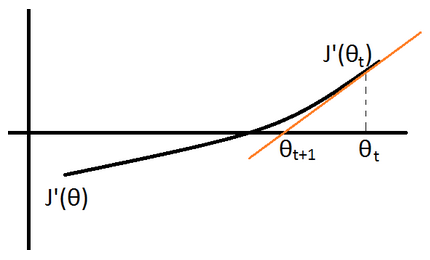
\(J”(θ_{t}) := \frac{J'(θ_{t+1}) – J'(θ_{t})}{θ_{t+1} – θ_{t}}\) \(\rightarrow θ_{t+1} := θ_{t} – \frac{J'(θ_{t})}{J”(θ_{t})}\)

Matrix differentiation

To minimize the cost function: \(J(θ) = \frac{1}{2} \sum_{i=1}^{n} (y^{(i)}-h_{θ}(x^{(i)}))^{2} = \frac{1}{2} (Xθ – y)^T(Xθ – y)\), we need to solve the equation:

\( \frac{\partial J(θ)}{\partial θ} = 0 \\ \frac{\partial θ^TX^TXθ – θ^TX^Ty – y^TXθ + y^Ty}{\partial θ} = 2X^TXθ – \frac{\partial θ^TX^Ty}{\partial θ} – X^Ty = 0\)

\(2X^TXθ – \frac{\partial y^TXθ}{\partial θ} – X^Ty = 2X^TXθ – 2X^Ty = 0\) (Note: In matrix differentiation: \( \frac{\partial Aθ}{\partial θ} = A^T\) and \( \frac{\partial θ^TAθ}{\partial θ} = 2A^Tθ\))

we can deduce \(X^TXθ = X^Ty\) and \(θ = (X^TX)^{-1}X^Ty\)

Logistic Regression

Below a table that shows tumor types by size.

x = Tumor Size (cm)

y = Tumor Type (Benign=0, Malignant=1)

1

0

1

0

2

0

2

1

3

1

3

1

Given x, y is distributed according to the Bernoulli distribution with probability of success p = E[y|x].

\(P(y|x;θ) = p^y (1-p)^{(1-y)}\)

We define h(x) as a function that returns the expected value (p) of the distribution. We will define this function as:

\(E[y|x] = h_{θ}(x) = g(θ^T x) = \frac{1}{1+exp(-θ^T x)}\). g is called Sigmoid (or logistic) function.

P(y|x; θ) = \(h_{θ}(x)^y (1-h_{θ}(x))^{(1-y)}\)

We need to find θ that maximizes this probability for all values of x. In other words, we need to find θ that maximizes the likelihood function L:

\(L(θ)=P(\overrightarrow{y}|X;θ)=\prod_{i=1}^{m} P(y^{(i)}|x^{(i)};θ)\)

Or maximize the log likelihood function l:

\(l(θ)=log(L(θ)) = \sum_{i=1}^{m} log(P(y^{(i)}|x^{(i)};θ ))\) \(= \sum_{i=1}^{m} y^{(i)} log(h_{θ}(x^{(i)}))+ (1-y^{(i)}) log(1-h_{θ}(x^{(i)}))\)

Or minimize the \(-l(θ) = \sum_{i=1}^{m} -y^{(i)} log(h_{θ}(x^{(i)})) – (1-y^{(i)}) log(1-h_{θ}(x^{(i)})) = J(θ) \)

J(θ) is convex, to minimize it, we need to solve the equation \(\frac{\partial J(θ)}{\partial θ} = 0\).

There are many methods to solve this equation:

  • Gradient descent

Gradient descent

\(θ_{j} := θ_{j} – α \sum_{i=1}^{n} (h_{θ}(x^{(i)}) – y^{(i)}) * x_j^{(i)} \)

Logit function (inverse of logistic function)

Logit function is defined as follow: \(logit(p) = log(\frac{p}{1-p})\)

The idea in the use of this function is to transform the interval of p (outcome) from [0,1] to [0, ∞]. So instead of applying linear regression on p, we will apply it on logit(p).

Once we find θ that maximizes the Likelihood function, we can then estimate logit(p) given a value of x (\(logit(p) = h_{θ}(x) \)). p can be then calculated using the following formula:

\(p = \frac{1}{1+exp(-logit(h_{θ}(x)))}\)

Multinomial Logistic Regression (using maximum likelihood estimation)

In multinomial logistic regression (also called Softmax Regression), y could have more than two outcomes {1,2,3,…,k}.

Below a table that shows tumor types by size.

x = Tumor Size (cm)

y = Tumor Type (Type1= 1, Type2= 2, Type3= 3)

1

1

1

1

2

2

2

2

2

3

3

3

3

3

Given x, we can define a multinomial distribution with probabilities of success \(\phi_j = E[y=j|x]\).

\(P(y=j|x;\Theta) = Ï•_j \\ P(y=k|x;\Theta) = 1 – \sum_{j=1}^{k-1} Ï•_j \\ P(y|x;\Theta) = Ï•_1^{1\{y=1\}} * … * Ï•_{k-1}^{1\{y=k-1\}} * (1 – \sum_{j=1}^{k-1} Ï•_j)^{1\{y=k\}}\)

We define \(\tau(y)\) as a function that returns a \(R^{k-1}\) vector with value 1 at the index y: \(\tau(y) = \begin{bmatrix}0\\0\\1\\0\\0\end{bmatrix}\), when \(y \in \{1,2,…,k-1\}\), .

and \(\tau(y) = \begin{bmatrix}0\\0\\0\\0\\0\end{bmatrix}\), when y = k.

We define \(\eta(x)\) as a \(R^{k-1}\) vector = \(\begin{bmatrix}log(\phi_1/\phi_k)\\log(\phi_2/\phi_k)\\…\\log(\phi_{k-1}/\phi_k)\end{bmatrix}\)

\(P(y|x;\Theta) = 1 * exp(η(x)^T * \tau(y) – (-log(\phi_k)))\)

This form is an exponential family distribution form.

We can invert \(\eta(x)\) and find that:

\(ϕ_j = ϕ_k * exp(η(x)_j)\) \(= \frac{1}{1 + \frac{1-ϕ_k}{ϕ_k}} * exp(η(x)_j)\) \(=\frac{exp(η(x)_j)}{1 + \sum_{c=1}^{k-1} ϕ_c/ϕ_k}\) \(=\frac{exp(η(x)_j)}{1 + \sum_{c=1}^{k-1} exp(η(x)_c)}\)

If we define η(x) as linear function, \(η(x) = Θ^T x = \begin{bmatrix}Θ_{1,1} x_1 +… + Θ_{n,1} x_n \\Θ_{1,2} x_1 +… + Θ_{n,2} x_n\\…\\Θ_{1,k-1} x_1 +… + Θ_{n,k-1} x_n\end{bmatrix}\), and Θ is a \(R^{n*(k-1)}\) matrix.

Then: \(ϕ_j = \frac{exp(Θ_j^T x)}{1 + \sum_{c=1}^{k-1} exp(Θ_c^T x)}\)

The hypothesis function could be defined as: \(h_Θ(x) = \begin{bmatrix}\frac{exp(Θ_1^T x)}{1 + \sum_{c=1}^{k-1} exp(Θ_c^T x)} \\…\\ \frac{exp(Θ_{k-1}^T x)}{1 + \sum_{c=1}^{k-1} exp(Θ_c^T x)} \end{bmatrix}\)

We need to find Θ that maximizes the probabilities P(y=j|x;Θ) for all values of x. In other words, we need to find θ that maximizes the likelihood function L:

\(L(θ)=P(\overrightarrow{y}|X;θ)=\prod_{i=1}^{m} P(y^{(i)}|x^{(i)};θ)\) \(=\prod_{i=1}^{m} \phi_1^{1\{y^{(i)}=1\}} * … * \phi_{k-1}^{1\{y^{(i)}=k-1\}} * (1 – \sum_{j=1}^{k-1} \phi_j)^{1\{y^{(i)}=k\}}\) \(=\prod_{i=1}^{m} \prod_{c=1}^{k-1} \phi_c^{1\{y^{(i)}=c\}} * (1 – \sum_{j=1}^{k-1} \phi_j)^{1\{y^{(i)}=k\}}\)

\(=\prod_{i=1}^{m} \prod_{c=1}^{k-1} \phi_c^{1\{y^{(i)}=c\}} * (1 – \sum_{j=1}^{k-1} \phi_j)^{1\{y^{(i)}=k\}}\) and \(Ï•_j = \frac{exp(Θ_j^T x)}{1 + \sum_{c=1}^{k-1} exp(Θ_c^T x)}\)

Multinomial Logistic Regression (using cross-entropy minimization)

In this section, we will try to minimize the cross-entropy between Y and estimated \(\widehat{Y}\).

We define \(W \in R^{d*n}\), \(b \in R^{d}\) such as \(S(W x + b) = \widehat{Y}\), S is the Softmax function, k is the number of outputs, and \(x \in R^n\).

To estimate W and b, we will need to minimize the cross-entropy between the two probability vectors Y and \(\widehat{Y}\).

The cross-entropy is defined as below:

\(D(\widehat{Y}, Y) = -\sum_{j=1}^d Y_j Log(\widehat{Y_j})\)

Example:

if \(\widehat{y} = \begin{bmatrix}0.7 \\0.1 \\0.2 \end{bmatrix} \& \ y=\begin{bmatrix}1 \\0 \\0 \end{bmatrix}\) then \(D(\widehat{Y}, Y) = D(S(W x + b), Y) = -1*log(0.7)\)

We need to minimize the entropy for all training examples, therefore we will need to minimize the average cross-entropy of the entire training set.

\(L(W,b) = \frac{1}{m} \sum_{i=1}^m D(S(W x^{(i)} + b), y^{(i)})\), L is called the loss function.

If we define \(W = \begin{bmatrix} — θ_1 — \\ — θ_2 — \\ .. \\ — θ_d –\end{bmatrix}\) such as:

\(θ_1=\begin{bmatrix}θ_{1,0}\\θ_{1,1}\\…\\θ_{1,n}\end{bmatrix}, θ_2=\begin{bmatrix}θ_{2,0}\\θ_{2,1}\\…\\θ_{2,n}\end{bmatrix}, θ_d=\begin{bmatrix}θ_{d,0}\\θ_{d,1}\\…\\θ_{d,n}\end{bmatrix}\)

We can then write \(L(W,b) = \frac{1}{m} \sum_{i=1}^m D(S(W x^{(i)} + b), y^{(i)})\)

\(= \frac{1}{m} \sum_{i=1}^m \sum_{j=1}^d 1^{\{y^{(i)}=j\}} log(\frac{exp(θ_k^T x^{(i)})}{\sum_{k=1}^d exp(θ_k^T x^{(i)})})\)

For d=2 (nbr of class=2), \(= \frac{1}{m} \sum_{i=1}^m 1^{\{y^{(i)}=\begin{bmatrix}1 \\ 0\end{bmatrix}\}} log(\frac{exp(θ_1^T x^{(i)})}{exp(θ_1^T x^{(i)}) + exp(θ_2^T x^{(j)})}) + 1^{\{y^{(i)}=\begin{bmatrix}0 \\ 1\end{bmatrix}\}} log(\frac{exp(θ_2^T x^{(i)})}{exp(θ_1^T x^{(i)}) + exp(θ_2^T x^{(i)})})\)

\(1^{\{y^{(i)}=\begin{bmatrix}1 \\ 0\end{bmatrix}\}}\) means that the value is 1 if \(y^{(i)}=\begin{bmatrix}1 \\ 0\end{bmatrix}\) otherwise the value is 0.

To estimate \(θ_1,…,θ_d\), we need to calculate the derivative and update \(θ_j = θ_j – α \frac{\partial L}{\partial θ_j}\)

Kernel regression

Kernel regression is a non-linear model. In this model we define the hypothesis as the sum of kernels.

\(\widehat{y}(x) = ϕ(x) * θ = θ_0 + \sum_{i=1}^d K(x, μ_i, λ) θ_i \) such as:

\(Ï•(x) = [1, K(x, μ_1, λ),…, K(x, μ_d, λ)]\) and \(θ = [θ_0, θ_1,…, θ_d]\)

For example, we can define the kernel function as : \(K(x, μ_i, λ) = exp(-\frac{1}{λ} ||x-μ_i||^2)\)

Usually we select d = number of training examples, and \(μ_i = x_i\)

Once the vector ϕ(X) calculated, we can use it as new engineered vector, and then use the normal equation to find θ:

\(θ = {(ϕ(X)^Tϕ(X))}^{-1}ϕ(X)^Ty\)

Bayes Point Machine

The Bayes Point Machine is a Bayesian linear classifier that can be converted to a nonlinear classifier by using feature expansions or kernel methods as the Support Vector Machine (SVM).

More details will be provided.

Ordinal Regression

Ordinal Regression is used for predicting an ordinal variable. An ordinal variable is a categorical variable for which the possible values are ordered (eg. size: Small, Medium, Large).

More details will be provided.

Poisson Regression

Poisson regression assumes the output variable Y has a Poisson distribution, and assumes the logarithm of its expected value can be modeled by a linear function.

log(E[Y|X]) = log(λ) = θ.x

Feature Engineering

Hashing

Feature hashing is used to convert a categorical feature into a small-dimension feature space.

For example a vocabulary of words can be represented in a 5 dimensional space \(\{0,1\}^5\) (e.g. Apple → [1,0,1,1,0]).

Hashing introduces noise as collisions are permitted (Car→ [0,0,0,1,1], Flight→ [0,0,0,1,1]).

Embedding

With embedding the representation is more dense (e.g. Car → [0.4,0.9,0.1,0,0.1])

Bucketing

Bucketing is a technique for decomposing feature values into buckets.

Crossing

Crossing features is combining multiple features in one feature.

Recurrent Neural Network

Architecture

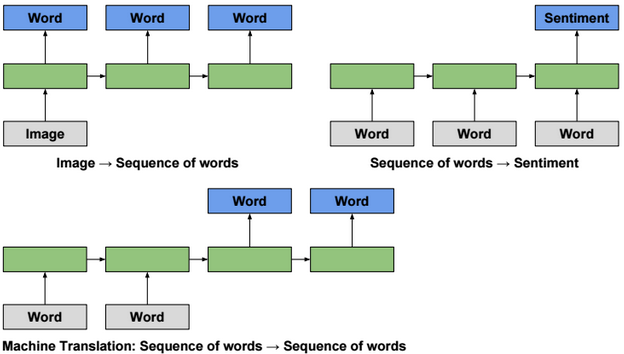
RNNs are generally used for sequence modeling (e.g. language modeling, time series modeling,…).

Unfolding a RNN network (many to many scenario) could be presented as follow:

When training the model, we need to find W that minimizes the sum of losses.

Multilayer RNN

Multilayer RNN is a neural network with multiple RNN layers.

Backpropagation through time

To train a RNN, we need to calculate the gradient to update parameters. Instead of doing the derivations for the full network, we will focus only on one hidden unit.

We define \(s_t = g(W.x_t + U.s_{t-1} + b) \). g is an activation function.

Using the chain rule we can find that:

\(\frac{\partial loss(y_t,?_t)}{\partial W} = \frac{\partial loss(y_t,?_t)}{\partial ?_t}.\frac{\partial ?_t}{\partial s_t}.\frac{\partial s_t}{\partial W} \\ = \frac{\partial loss(y_t,?_t)}{\partial ?_t}.\frac{\partial ?_t}{\partial s_t}.(\sum_{k=t}^0 \frac{\partial s_t}{\partial s_k}.\frac{\partial s_k}{\partial W})\)

Vanishing gradient

The term in red in the equation is a product of Jacobians (\(\frac{\partial s_t}{\partial s_k} = \prod_{i=k+1}^{t} \frac{\partial s_{i}}{\partial s_{i-1}}\)).

\(\frac{\partial loss(y_t,?_t)}{\partial ?_t}.\frac{\partial ?_t}{\partial s_t}.(\sum_{k=t}^0 \color{red} {\frac{\partial s_t}{\partial s_k}}.\frac{\partial s_k}{\partial W})\)

Because the derivatives of activation functions (except ReLU) are less than 1, therefore when evaluating the gradient, the red term tends to converge to 0, and the model becomes more biased and captures less dependencies.

Exploding gradient

RNN is trained by backpropagation through time. When gradient is passed back through many time steps, it tends to vanish or to explode.

Gradient Clipping

Gradient Clipping is a technique to prevent exploding gradients in very deep networks, typically Recurrent Neural Networks. There are various ways to perform gradient clipping, but the most common one is to normalize the gradients of a parameter vector when its L2 norm exceeds a certain threshold according to : \(gradients := gradients * \frac{threshold}{L2 norm(gradients)}\).

Long Short Term Memory (LSTM)

LSTM was introduced to solve the vanishing gradient problem.

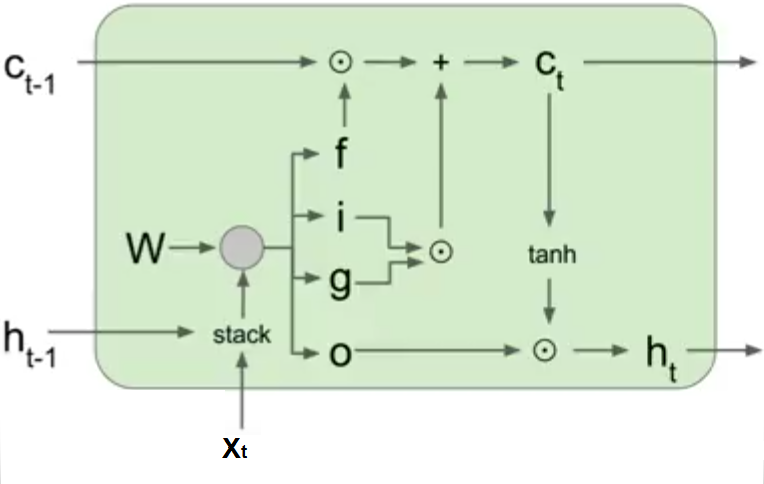
In LSTM, there are 4 gates that regulate the state of a RNN model:

Write gate (i?[0,1]) (Input gate): Write to memory cell.

Keep gate (f?[0,1]) (Forget gate): Erase memory cell.

Read gate (o?[0,1]) (Output gate): Read from memory cell.

Gate gate (g?[-1,1]) (Update gate) How much to write to memory cell.

\(c_t\) is called memory state at time t.

i,f,o,g,h,c are vectors having the same size. W is a matrix with size nxh.
The gate states are calculated using the following formula:

The output \(h_t\) is calculated using the following formulas:

\(c_t = f.c_{t-1} + i.g \\ h_t = o.tanh(c_t)\)

Gated Recurrent Unit (GRU)

The Gated Recurrent Unit is a simplified version of an LSTM unit with fewer parameters. Just like an LSTM cell, it uses a gating mechanism to allow RNNs to efficiently learn long-range dependency by preventing the vanishing gradient problem. The GRU consists of a reset and update gates that determine which part of the old memory to keep or update with new values at the current time step.

Introduction to Quantum Computing

“I think I can safely say that nobody understands quantum mechanics.” ~ Richard Feynman.

Hilbert space

Hilbert space is generalization of the Euclidean space. In a Hilbert space we can have infinite number of dimensions.

A vector in an infinite-dimensional Hilbert space is represented as an infinite vector: \((x_1, x_2, ….)\).

The inner product of two vectors \(?x|y? = \sum_{i=1}^? x_i y_i\)

The norm \( ||x|| = ?x|x?^{\frac{1}{2}} = \sqrt{\sum_{i=1}^? x_i^2} < ?\)

Tensor product of two vectors \(\begin{bmatrix} a_1 \\ a_2 \end{bmatrix} ? \begin{bmatrix} b_1 \\ b_2 \end{bmatrix} = \begin{bmatrix} a_1 * b_1 \\ a_1 * b_2 \\ a_2 * b_1 \\ a_2 * b_2 \end{bmatrix}\)

Qubit

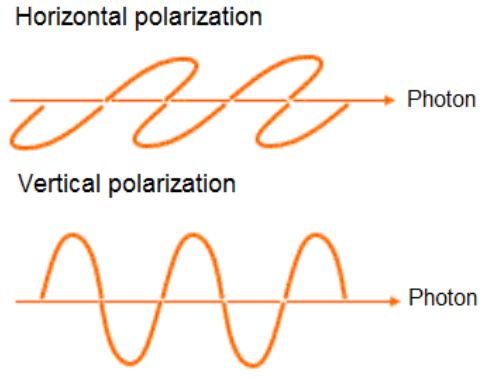
In quantum computing, a qubit or quantum bit is a unit of quantum information. It’s the analog of a bit for quantum computation. A qubit is a two-state quantum-mechanical system. The state 0 could be represented as vector \(\begin{bmatrix} 1 \\ 0 \end{bmatrix} ? |0? ? |??\) (horizontal polarization) and state 1 could be represented as orthogonal vector \(\begin{bmatrix} 0 \\ 1 \end{bmatrix} ? |1? ? |??\) (vertical polarization) .

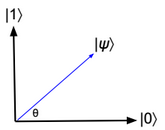
A generic qubit state corresponds to a vector \(\begin{bmatrix} ? \\ ? \end{bmatrix} = ? \begin{bmatrix} 1 \\ 0 \end{bmatrix} + ? \begin{bmatrix} 0 \\ 1 \end{bmatrix} ? ? \ |0? + ? \ |1? \) in a two-dimensional Hilbert space such as \(|?|^2 + |?|^2 = 1\) (normalized vector). \(|?|^2, |?|^2\) are the probabilities for the particle to be in state 0 and 1. ? and ? are complex numbers and they are called amplitudes.

Another way to write the state ? of a qubit is by using cos and sin functions.

|?? = cos(?) |0? + sin(?) |1?

More details about qubit can be found here: https://arxiv.org/pdf/1312.1463.pdf

Two qubits

A state in a combined two qubits system corresponds to a vector in four-dimensional Hilbert space \(|\gamma? = e \ |00? + f \ |01? + g \ |10?+ h \ |11? = \begin{bmatrix} e \\ f \\ g \\ h \end{bmatrix} \).

In general, the state vector of two combined systems is the tensor product of the state vector of each system.

Some expressions and their equivalents:

|0??|0??|0? ? |000?

|0??|1??|0? ? |010?

\((\sqrt{\frac{1}{2}}|0? + \sqrt{\frac{1}{2}}|1?)?(\sqrt{\frac{1}{2}}|0? + \sqrt{\frac{1}{2}}|1?) ? \frac{1}{2}|00? + \frac{1}{2}|01? + \frac{1}{2}|10? + \frac{1}{2}|11?\)

Bloch sphere

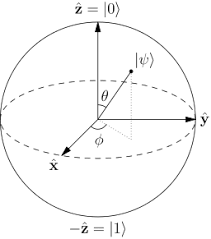
A state ? of a qubit can be also written as: \(|?? = cos(\frac{?}{2})|0? + sin(\frac{?}{2}) exp(i?) |1?\), and it can be visualized as a vector of length 1 on the Bloch sphere.

The angles ?,? correspond to the polar and azimuthal angles of spherical coordinates (??[0,?], ??[0,2?]).

Bra-ket notation

|01? ? |0??|1? ? \(\begin{bmatrix} 0 \\ 1 \\ 0 \\ 0 \end{bmatrix} \) (column vector)

?01| ? ?0|??1| ? \(\begin{bmatrix} 0 \ 1 \ 0 \ 0 \end{bmatrix} \) (row vector)

Quantum superposition

An arbitrary state of a qubit could be described as a superposition of 0 and 1 states.

N qubits

A 3 qubits quantum system can store numbers such as 3 or 7.

|011? ? |3?

|111? ? |7?

But it can also store the two numbers simultaneously using a superposition state on the last qubit.

\((\sqrt{\frac{1}{2}}|0? + \sqrt{\frac{1}{2}}|1?)?|1??|1? ? \sqrt{\frac{1}{2}} (|011? + |111?)\)

In general, a quantum computer with n qubits can be in an arbitrary superposition of up to \(2^n\) different states simultaneously.

Quantum gates

Hadamard H gate

The Hadamard gate acts on a single qubit. It maps the state |0? to a superposition state with equal probabilities on state 0 and 1 (\(\sqrt{\frac{1}{2}}|0? + \sqrt{\frac{1}{2}}|1?\)).

The Hadamard matrix is defined as: \(H = \frac {1}{\sqrt {2}} \begin{bmatrix}1 \ 1 \\ 1 \ -1 \end{bmatrix}\)

\(H * \begin{bmatrix} 1 \\ 0 \end{bmatrix} = \begin{bmatrix} \sqrt{\frac{1}{2}} \\ \sqrt{\frac{1}{2}} \end{bmatrix}\)

Pauli X gate (NOT gate)

The Pauli-X gate acts on a single qubit. It is the quantum equivalent of the NOT gate for classical computers.

The Pauli X matrix is defined as: \(X = \begin{bmatrix}0 \ 1 \\ 1 \ 0 \end{bmatrix}\)

\(X * \begin{bmatrix} 1 \\ 0 \end{bmatrix} = \begin{bmatrix} 0 \\ 1 \end{bmatrix}\)

Pauli Y gate

The Pauli-Y gate acts on a single qubit. It equates to a rotation around the Y-axis of the Bloch sphere by ? radians. It maps |0? to i |1? and |1? to ?i |0?

The Pauli Y matrix is defined as: \(Y = \begin{bmatrix}0 \ -i \\ i \ 0 \end{bmatrix}\)

\(Y * \begin{bmatrix} 1 \\ 0 \end{bmatrix} = \begin{bmatrix} 0 \\ i \end{bmatrix}\)

Pauli Z gate

The Pauli-Z gate acts on a single qubit. It equates to a rotation around the Z-axis of the Bloch sphere by ? radians. It leaves the basis state |0? and maps |1? to ?|1?

The Pauli Z matrix is defined as: \(Z = \begin{bmatrix}1 \ 0 \\ 0 \ -1 \end{bmatrix}\)

\(Z * \begin{bmatrix} 1 \\ 0 \end{bmatrix} = \begin{bmatrix} 1 \\ 0 \end{bmatrix}\)

Other gates are described in this link: https://en.wikipedia.org/wiki/Quantum_gate

State measurement

State measurement can be done using polarizing filters. Filters transmit or block particles based on angle of polarization.

IBM Q

IBM Q is a cloud quantum computing platform.

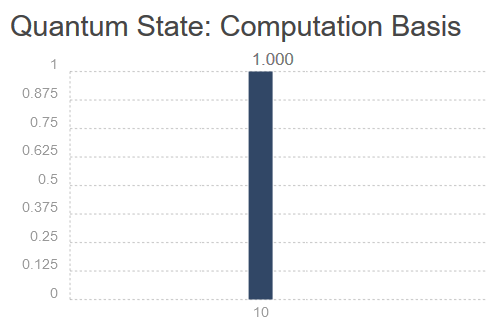
Below a simple experiment where we have two qubits. No transformation is applied on first qubit. A Pauli X transformation is applied on second qubit. As result there is one possible state |10? with probability equals 1.

Data representation

Given a vector \(x = (x_1, x_2, …. , x_n)\). The quantum system topology needed to store the vector x is \(log_2(n)\) qubits.

For example, the quantum system representation of the following vector requires only 3 qubits.

(0, 0.2, 0.2, 0, 0.1, 0.2, 0.1, 0.3) ? 0 |000? + 0.2 |001? + 0.2 |010? + 0 |011? + 0.1 |100? + 0.2 |101? + 0.1 |110? + 0.3 |111?

Neural Network

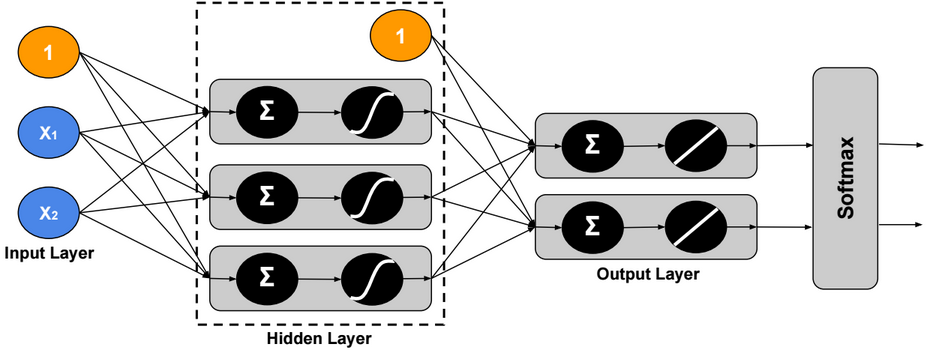
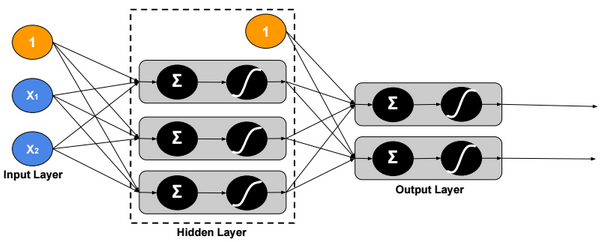
A neural network is a non-linear classifier (separator is not a linear function). It can also be used for regression.

A Shallow neural network is a one hidden layer neural network.

A Vanilla neural network is a regular neural network having layers that do not form cycles.

TensorFlow Playground is an interactive web interface for learning neural networks: http://playground.tensorflow.org.

Computational Graph

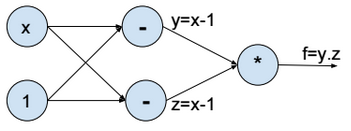
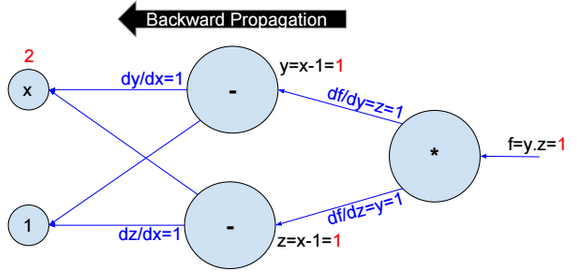
Above the computational graph for the function \(f(x) = (x-1)^2\).

Forward propagation

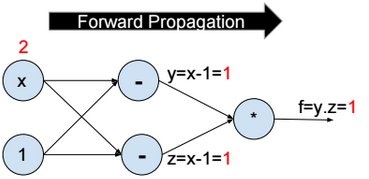
To minimize the function f, we assign a random value to x (e.g. x = 2), then we evaluate y, z, and f (forward propagation).

Backward propagation

Then we compute the partial derivative of f with respect to x step by step (Backward propagation).

\(\frac{\partial f}{\partial x} = \frac{\partial f}{\partial y}*\frac{\partial y}{\partial x} + \frac{\partial f}{\partial z}*\frac{\partial z}{\partial x} = 2 \\ \frac{\partial f}{\partial y} = z = 1 \\ \frac{\partial f}{\partial z} = y = 1 \\ \frac{\partial y}{\partial x} = \frac{\partial z}{\partial x} = 1\)

Then we update \(x:= x – ?.\frac{\partial f}{\partial x}\).

We repeat the operation until convergence.

Activation functions

Activation functions introduce nonlinearity into models. The most used activation functions are:

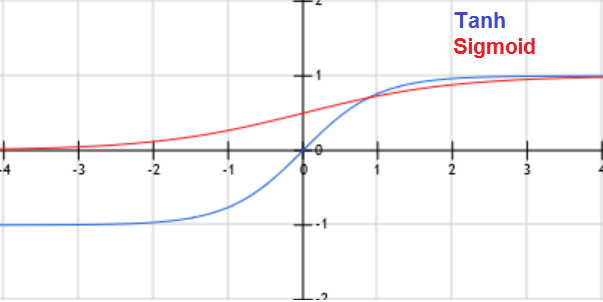
Sigmoid

\(f(x) = \frac{1}{1+exp(-x)}\)

Sigmoid has a positive and non-zero centred output (sigmoid(0) ? 0.5).

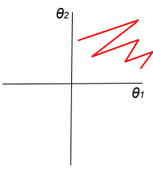
When all activation units are positive, then weight update will be in the same direction (all positive or all negative updates) and that will cause a zigzag path during optimization.

\(z=?w_i.a_i+b \\ \frac{dL}{dw_i}=\frac{dL}{dz}.\frac{dz}{dw_i}=\frac{dL}{dz}.ai\)

If all ai>0, then the gradient will have the same sign as \(\frac{dL}{dz}\) (all positive or all negative).

TanH

\(f(x) = \frac{2}{1+exp(-2x)} -1\)

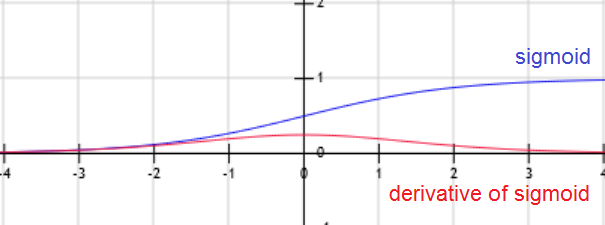
When x is large, the derivative of the sigmoid or Tanh function is around zero (vanishing gradient/saturation).

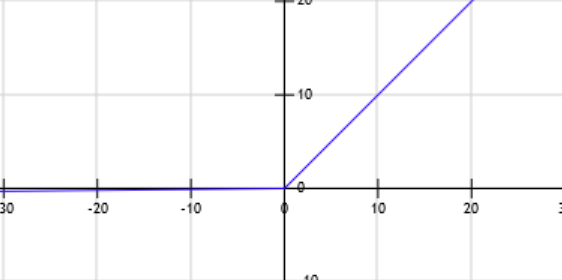
ReLU (Rectified Linear Unit)

f(x) = max(0, x)

Leaky ReLU

f(x) = max(0.01x, x)

Leaky Relu was introduced to fix the “Dying Relu” problem.

\(z=?w_i.a_i+b \\ f=Relu(z) \\ \frac{dL}{dw_i}=\frac{dL}{df}.\frac{df}{dz}.\frac{dz}{dw_i}\)

When z becomes negative, then the derivative of f becomes equal to zero, and the weights stop being updated.

PRelu (Parametric Rectifier)

f(x) = max(?.x, x)

ELU (Exponential Linear Unit)

f(x) = {x if x>0 otherwise ?.(exp(x)-1)}

Other activation functions: Maxout

Cost function

\(J(?) = \frac{1}{m} \sum_{i=1}^{m} loss(y^{(i)}, f(x^{(i)}; ?))\)

We need to find ? that minimizes the cost function: \(\underset{?}{argmin}\ J(?)\)

Neural Network Regression

Neural Network regression has no activation function at the output layer.

L1 Loss function

\(loss(y,?) = |y – ?|\)

L2 Loss function

\(loss(y,?) = (y – ?)^2\)

Hinge loss function

Hinge loss function is recommended when there are some outliers in the data.

\(loss(y,?) = max(0, |y-?| – m)\)

Two-Class Neural Network

Binary Cross Entropy Loss function

\(loss(y,?) = – y.log(?) – (1-y).log(1 – ?)\)

Multi-Class Neural Network – One-Task

Using Softmax, the output ? is modeled as a probability distribution, therefore we can assign only one label to each example.

Cross Entropy Loss function

\(loss(Y,\widehat{Y}) = -\sum_{j=1}^c Y_{j}.log(\widehat{Y}_{j})\)

Hinge Loss (SVM) function

\(y = \begin{bmatrix} 1 \\ 0 \\ 0 \end{bmatrix},\ ? = \begin{bmatrix} 2 \\ -5 \\ 3 \end{bmatrix} \\ loss(y,?) = \sum_{c?1} max(0, ?_c – ?_1 + m)\)

For m = 1, the sum will be equal to 2.

Multi-Class Neural Network – Multi-Task

In this version, we assign multiple labels to each example.

Loss function

\(loss(Y,\widehat{Y}) = \sum_{j=1}^c – Y_j.log(\widehat{Y}_j) – (1-Y_j).log(1 – \widehat{Y}_j)\)

Regularization

Regularization is a very important technique to prevent overfitting.

Dropout

For each training example, ignore randomly p activation nodes of each hidden layer. p is called dropout rate (p?[0,1]). When testing, scale activations by the dropout rate p.

Inverted Dropout

With inverted dropout, scaling is applied at the training time, but inversely. First, dropout all activations by dropout factor p, and second, scale them by inverse dropout factor 1/p. Nothing needs to be applied at test time.

Data Augmentation

As a regularization technique, we can apply random transformations on input images when training a model.

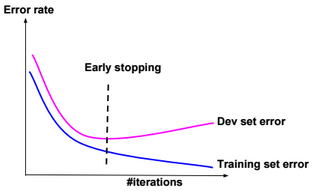
Early stopping

Stop when error rates decreases on training data while it increases on dev (cross-validation) data.

L1 regularization

\(J(?) = \frac{1}{m} \sum_{i=1}^{m} loss(y^{(i)}, f(x^{(i)}; ?)) \color{blue} { + ? .\sum_{j} |?_j|} \)

? is called regularization parameter

L2 regularization

\(J(?) = \frac{1}{m} \sum_{i=1}^{m} loss(y^{(i)}, f(x^{(i)}; ?)) \color{blue} { + ? .\sum_{j} ?_j^2} \)

Lp regularization

\(J(?) = \frac{1}{m} \sum_{i=1}^{m} loss(y^{(i)}, f(x^{(i)}; ?)) \color{blue} { + ? .\sum_{j} ?_j^p} \)

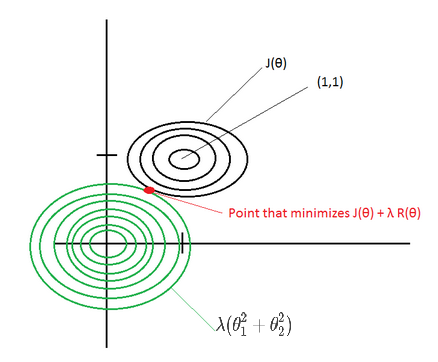
For example, if the cost function \(J(?)=(?_1 – 1)^2 + (?_2 – 1)^2\), then the \(L_2\) regularized cost function is \(J(?)=(?_1 – 1)^2 + (?_2 – 1)^2 + ? (?_1^2 + ?_2^2)\)

If ? is large, then the point that minimizes the regularized J(?) will be around (0,0) –> Underfitting.

If ? ~ 0, then the point that minimizes the regularized J(?) will be around (1,1) –> Overfitting.

Elastic net

Combination of L1 and L2 regularizations.

Normalization

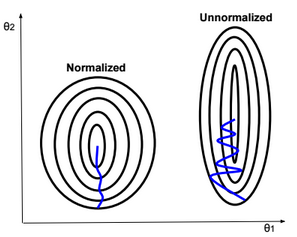
Gradient descent converges quickly when data is normalized Xi ? [-1,1]. If features have different scales, then the update of parameters will not be in the same scale (zig-zag).

For example, if the activation function g is the sigmoid function, then when W.x+b is large g(W.x+b) is around 1, but the derivative of the sigmoid function is around zero. For this reason the gradient converges slowly when the W.x+b is large.

Below some normalization functions.

ZScore

\(X:= \frac{X – ?}{?}\)

MinMax

\(X:= \frac{X – min}{max-min}\)

Logistic

\(X:= \frac{1}{1+exp(-X)}\)

LogNormal

\(X:= \frac{1}{?\sqrt{2?}} \int_{0}^{X} \frac{exp(\frac{-(ln(t) – ?)^2}{2?^2})}{t} dt\)

Tanh

\(X:= tanh(X)\)

Weight Initialization

Weight initialization is important because if weights are too big then activations explode. If weights are too small then gradients will be around zero (no learning).

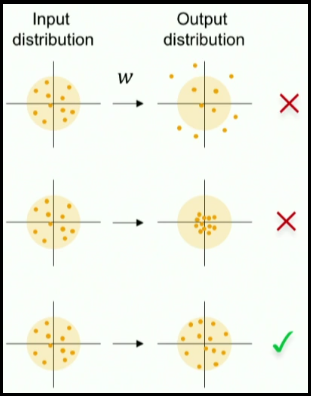
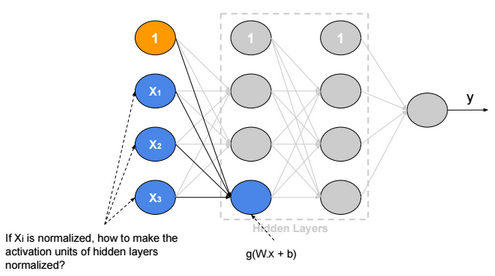
When we normalize input data, we make the mean of the input features equals to zero, and the variance equals to one. To keep the activation units normalized too, we can initialize the weights \( W^{(1)}\) so \(Var(g(W_{j}^{(1)}.x+b_{j}^{(1)}))\) is equals to one.

If we suppose that g is Relu and \(W_{i,j}, b_j, x_i\) are independent, then:

\(Var(g(W_{j}^{(1)}.x+b_{j}^{(1)})) = Var(\sum_{i} W_{i,j}^{(1)}.x_i+b_{j}^{(1)}) =\sum_{i} Var(W_{i,j}^{(1)}.x_i) + 0 \\ = \sum_{i} E(x_i)^2.Var(W_{i,j}^{(1)}) + E(W_{i,j}^{(1)})^2.Var(x_i) + Var(W_{i,j}^{(1)}).Var(x_i) \\ = \sum_{i} E(x_i)^2.Var(W_{i,j}^{(1)}) + E(W_{i,j}^{(1)})^2.Var(x_i) + Var(W_{i,j}^{(1)}).Var(x_i) \\ = \sum_{i} 0 + 0 + Var(W_{i,j}^{(1)}).Var(x_i) = n.Var(W_{i,j}^{(1)}).Var(x_i) \)

Xavier initialization

If we define \(W_{i,j}^{(1)} ? N(0,\frac{1}{\sqrt{n}})\), then the initial variance of activation units will be one (n is number of input units).

We can apply this rule on all weights of the neural network.

Batch Normalization

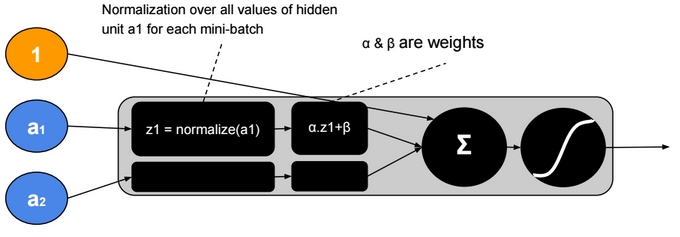
Batch normalization is a technique to provide any layer in a Neural Network with normalized inputs. Batch Normalization has a regularizing effect.

After training, ? will converge to the standard deviation of the mini-batches and ? will converge to the mean. The ?, ? parameters give more flexibility when shifting or scaling is needed.

Hyperparameters

Neural network hyperparameters are:

  • Learning rate (?) (e.g. 0.1, 0.01, 0.001,…)
  • Number of hidden units
  • Number of layers
  • Mini-bach size
  • Momentum rate (e.g. 0.9)
  • Adam optimization parameters (e.g. ?1=0.9, ?2=0.999, ?=0.00000001)
  • Learning rate decay

Local Minimum

The probability that gradient descent gets stuck in a local minimum in a high dimensional space is extremely low. We could have a saddle point, but it’s rare to have a local minimum.

Transfer Learning

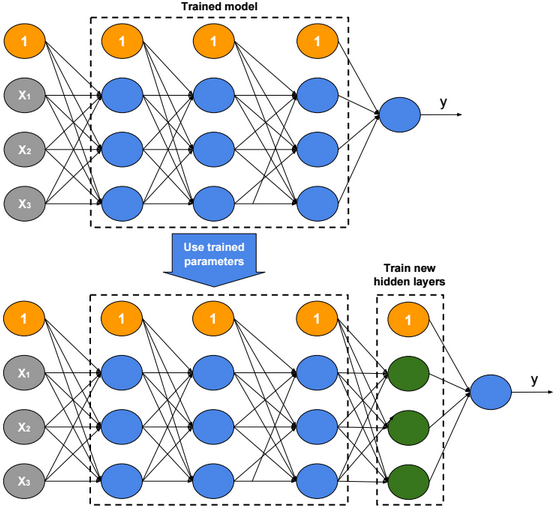
Transfer Learning consists in the use of parameters of a trained model when training new hidden layers of an extended version of that model.

Machine Learning Algorithms – Summary

Characteristics of Machine Learning Algorithms

Discriminative / Generative algorithms

Many machine learning algorithms are based on probabilistic models. Discriminative algorithms learn the conditional probability distribution of y given x p(y|x). Generative algorithms learn the joint probability distribution p(y,x) = p(y|x) * p(x), and therefore take in consideration the distribution of x.

Parametric & Non-Parametric algorithms

Neural Network, SVM,… are non-parametric algorithms because they have no fixed parameter vector; depending on the richness of the data we can choose the size of the parameter vector that we need (ex. we can add hidden units, change SVM kernels,…)

Capacity

The capacity is controlled by parameters called Hyperparameters (ex. degree p of a polynomial predictor, kernel choice in SVM, number of layers in a neural network).

Summary of Machine Learning Algorithms

The table below describes briefly each machine learning algorithm.

Algorithm

Description

Characteristics

Linear regression

To use when Y is normally-distributed

Discriminative

Parametric

Logistic regression

To use when Y is Bernoulli-distributed

Discriminative

Parametric

Multinomial logistic regression (softmax regression)

To use when Y is multinomially-distributed

There are two versions of the algorithm, one based on maximum likelihood maximization, and one based on cross-entropy minimization.

Discriminative

Parametric

Gaussian Discriminant Analysis

Supervised classification algorithm

To use when Y is Bernoulli distributed and the conditional distribution of X given Y is multivariate Gaussian

Generative

Parametric

Naive Bayes Algorithm

Supervised classification algorithm

To use when Y is Bernoulli, and the conditional distribution of X given Y is Bernoulli and X features are conditionally independent

Generative

Parametric

EM

Unsupervised soft-clustering algorithm

Generative

Parametric

Principal Component Analysis

Reduce the dimensionality of X.

Calculate eigenvectors for \(XX^T\). Use eigenvectors with higher eigenvalues to transform data \(x^{(i)} := (u_1^T x^{(i)}, u_2^T x^{(i)},…, , u_k^T x^{(i)})\)

Factor Analysis

Reduce the dimensionality of X

To use when X is Gaussian.

Transform X to Z matrix with lower dimensionality (x ? ?+?z).

Neural Network

Non-linear classifier

Discriminative

Non-Parametric

K-Nearest Neighbor Regression

Predict y as the average of values y1,y2,…,yk of k nearest neighbors of x

Discriminative

Non-Parametric

K-Nearest Neighbor Classifier

Predict y as the most common class among the k nearest neighbors of x

Discriminative

Non-Parametric

Support Vector Machine

Find a separator that maximizes the margin between two classes

Discriminative

Non-Parametric

K-means

Unsupervised hard-clustering algorithm

Discriminative

Non-Parametric